The Green Party of Canada was on the fringe until the last two elections. Previously they had a logical platform that was very similar to the Conservatives but with a focus on clean energy and illogical rejection of Nuclear energy. However, Green positions have recently moved the far left, by Canadian standards.
This repositioning of the party has put them in direct competition with the New Democratic Party for votes, as the Conservatives and Liberals attract nearly all of the center.
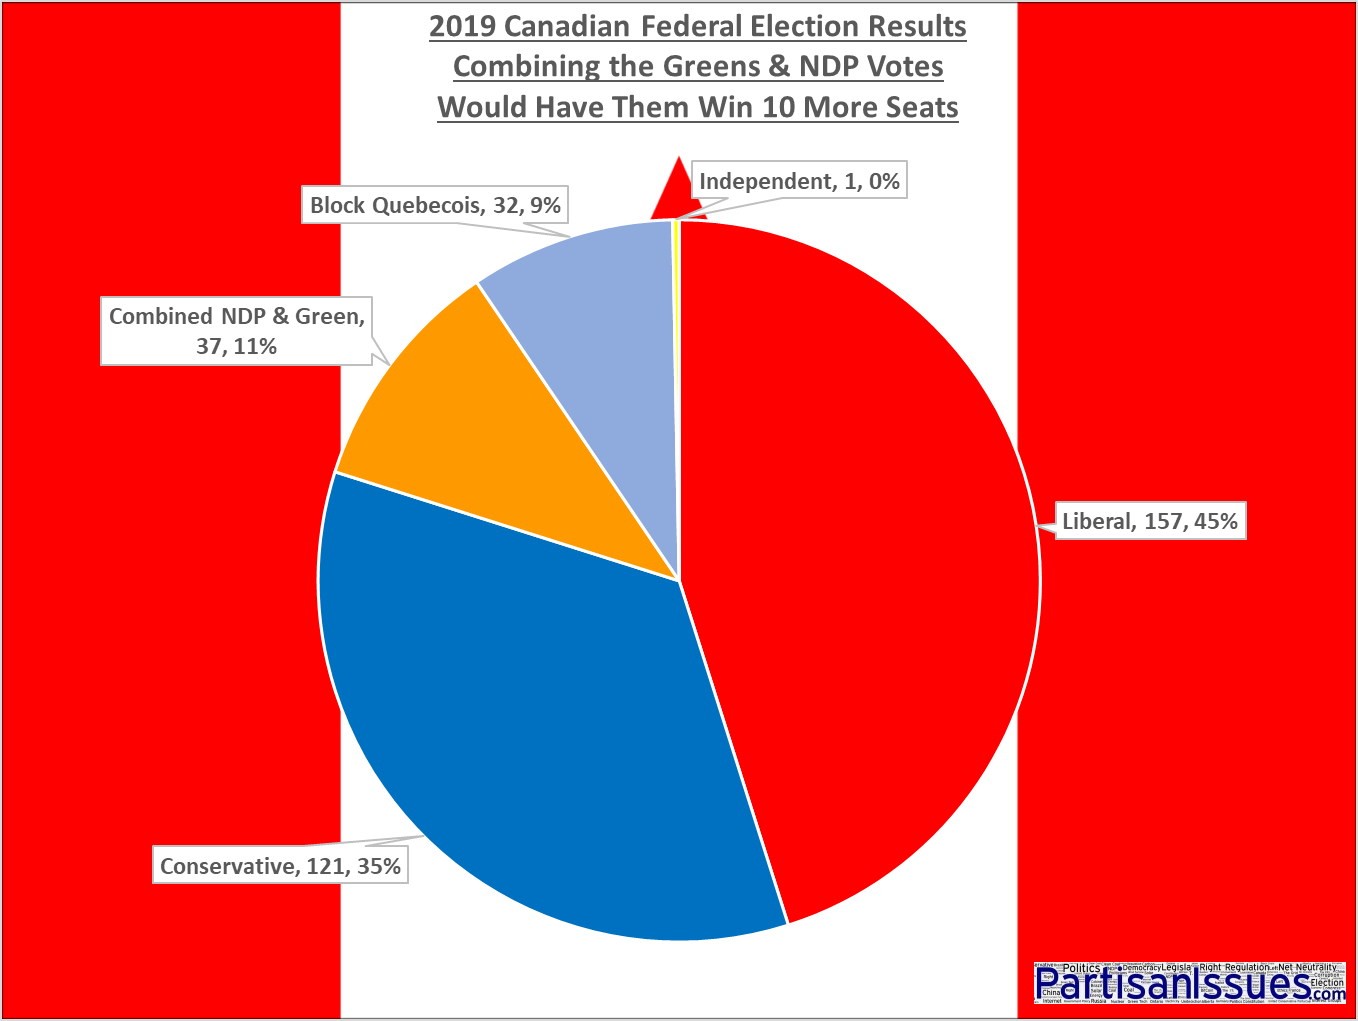
After the October 21st 2019 Canadian Federal Election, we thought it would be interesting to analyze the data and see what would have happened if the Green Party had not split the traditional left vote.
Adding the seats won by the Greens and NDP only totals to 27 which tells us almost nothing we did not already know. Instead we invested a few hours to combined the NDP and Green votes in each riding and tallied it up the winnings.
Putting NDP and Greens voters back together would have propelled them from being Canada’s forth and fifth place parties into Canada’s third place finisher with an historically significant 37 seats:
| Party | Seats |
| Liberal | 157 |
| Conservative | 121 |
| Combined NDP & Green | 37 |
| Block Quebecois | 32 |
| Independent | 1 |
Below are the results of every NDP election since inception in 1962. You can see in the last row that if Green and NDP supporters voted as one, they would have achieved a highly respectable 22.4%. Their historical average is just 16.6%.
In fact if the two parties had combined, the NDP/Greens would have had their second greatest finish ever:
| Election | Leader | Seats | +/– | Votes | % | Status/Gov. |
| 1962 | Tommy Douglas | 19 / 265 | Increase 11 | 1,044,754 | 13.57 | Fourth party |
| 1963 | 17 / 265 | Decrease 2 | 1,044,701 | 13.22 | Fourth party | |
| 1965 | 21 / 265 | Increase 4 | 1,381,658 | 17.91 | Third party | |
| 1968 | 22 / 264 | Increase 1 | 1,378,263 | 16.96 | Third party | |
| 1972 | David Lewis | 31 / 264 | Increase 9 | 1,725,719 | 17.83 | Third party |
| 1974 | 16 / 264 | Decrease 15 | 1,467,748 | 15.44 | Third party | |
| 1979 | Ed Broadbent | 26 / 282 | Increase 10 | 2,048,988 | 17.88 | Third party |
| 1980 | 32 / 282 | Increase 6 | 2,165,087 | 19.77 | Third party | |
| 1984 | 30 / 282 | Decrease 2 | 2,359,915 | 18.81 | Third party | |
| 1988 | 43 / 295 | Increase 13 | 2,685,263 | 20.38 | Third party | |
| 1993 | Audrey McLaughlin | 9 / 295 | Decrease 34 | 939,575 | 6.88 | No status |
| 1997 | Alexa McDonough | 21 / 301 | Increase 12 | 1,434,509 | 11.05 | Fourth party |
| 2000 | 13 / 301 | Decrease 8 | 1,093,748 | 8.51 | Fourth party | |
| 2004 | Jack Layton | 19 / 308 | Increase 6 | 2,127,403 | 15.68 | Fourth party |
| 2006 | 29 / 308 | Increase 10 | 2,589,597 | 17.48 | Fourth party | |
| 2008 | 37 / 308 | Increase 8 | 2,515,288 | 18.18 | Fourth party | |
| 2011 | 103 / 308 | Increase 66 | 4,508,474 | 30.63 | Official Opposition | |
| 2015 | Tom Mulcair | 44 / 338 | Decrease 59 | 3,441,409 | 19.71 | Third party |
| 2019 | Jagmeet Singh | 24 / 338 | Decrease 20 | 2,849,214 | 15.9 | Fourth party |
| 2019 | If NDP & Green Combined | 37 / 338 | Decrease 7 | 4,011,575 | 22.4% | Third party |
If you are interested in Canadian elections, you might find our article A View From The Inside Of The 2019 Canadian Federal Election: Everyone Can Vote to be worth three minutes of your time.
.


0 Comments